
Microsoft Excel is a powerful tool that goes beyond simple data entry and formatting. It’s a powerhouse for data analysis, providing users with an array of functions and features to perform complex calculations with ease. One fundamental statistical measure that Excel can help you calculate is the sample mean, which is the average of a set of numbers selected from a larger population. This guide will take you through the steps to calculate the sample mean effortlessly, ensuring you make the most of Excel’s capabilities.
Step 1: Input Your Data
Before you can calculate the sample mean, you need to input your data into Excel. Here’s how:
- Open Excel: Launch Microsoft Excel and open a new or existing worksheet.
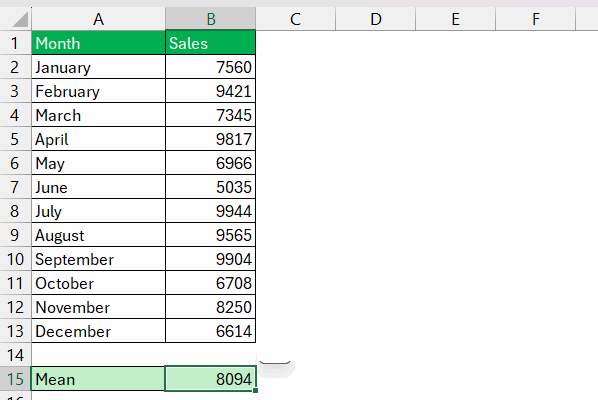
- Enter Data: Input your sample data into a single column or row. For instance, if you have a sample size of ten numbers, you might enter them into cells A1 through A10.
Step 2: Use the AVERAGE Function
Excel’s AVERAGE function makes calculating the mean straightforward:
- Select the Cell for the Result: Click on the cell where you want the mean to appear.
- Enter the Formula: Type
=AVERAGE(A1:A10)and press Enter. ReplaceA1:A10with the range of your data.
Excel will instantly calculate and display the mean of your sample data.
Step 3: Verify Your Calculation
It’s always good to double-check your work to ensure accuracy:
- Manual Check: If your sample size is small, manually add up the numbers and divide by the count to verify the mean.
- Cross-Check with Other Tools: Use a calculator or another software to cross-verify the result.
Step 4: Format Your Results
Presentation matters, especially when sharing your analysis:
- Select the Result Cell: Click on the cell containing the mean.
- Format as Needed: Use the formatting toolbar to adjust the number of decimal places, font size, or cell color to make your data stand out.
Step 5: Understanding the Importance of Sample Mean
The sample mean is a crucial statistical measure that provides insights into the central tendency of your data. It’s used in various fields, from finance to research, to draw meaningful conclusions from sample data.
Calculating the sample mean in Excel is just the tip of the iceberg when it comes to data analysis. Mastering this basic function opens the door to more advanced statistical analysis. With practice, you’ll find that Excel becomes an indispensable tool in your analytical toolkit, enabling you to handle data with ease and confidence.
I appreciate the detailed explanation of using the AVERAGE function in Excel. It really helps simplify data analysis tasks!
The guide does an excellent job of walking through each step clearly. I found the formatting tips particularly useful for presenting my data.
This article is a fantastic guide for anyone looking to understand how to use Excel for calculating the sample mean. The steps are clear and easy to follow.
Very informative! I love how it not only teaches you how to calculate the mean but also emphasizes verifying your calculations.
Great article! The step-by-step instructions make it so easy to calculate the sample mean. Perfect for beginners and experienced users alike.